- NO.
- 029
- DATE
- READ
- ~8 min
- KIND
- Case study
- STATUS
- Reviewed
Windows Memory: the Real Hog Was Me
16GB with WSL2 and VMware: chasing WSL, nonpaged pool, WebView2 and Widgets — and Apply/Restore made no difference. Chrome was always the answer.
My machine kept drifting toward 90% memory. It is only 16GB, sure, but I was not running anything huge — and the absurd part was that shortly after boot, with a few small startup apps, it was already at seventy or eighty percent.
Time to optimize, obviously.
Conclusion up front: this turned into a failed "memory optimization" and a fairly successful investigation.
I chased WSL, then the nonpaged pool, then WebView2, and eventually wrote a script to switch off Windows Widgets, web results in Search, and Delivery Optimization's P2P. Apply and Restore both ran fine. The result: basically no difference in memory.
The actual hogs had been sitting in the monitoring output the whole time: Chrome, WebView2 host apps, ChatGPT, and the pile of things I opened myself.
Hahaha. All that for nothing.
My setup
An HP Omen 8: 16GB RAM, i7-12700H, RTX 3050, the original 512GB SSD plus a 2TB drive added later.
The daily environment is not exactly light:
- Windows 11 as the host.
- WSL2 Ubuntu 24.04 running some services and startup tasks.
- Another Ubuntu 26.04 inside VMware.
- Chrome (a bottomless pit).
- ChatGPT / Codex Desktop.
- A proxy, Nutstore, Telegram, Typora, PowerToys, and friends running permanently.
So my first suspect was WSL.
First cut: cap WSL at 4GB
I let Codex CLI look around inside WSL first. Nothing anomalous surfaced, so I made a conservative move: put a memory ceiling on the WSL2 VM.
In %userprofile%\.wslconfig:
[wsl2]
memory=4GB
processors=4
Then it needs:
wsl --shutdownand a restart of the distribution before it takes effect.
Note the distinction: memory=4GB is the memory ceiling for the WSL2 VM, while processors=4 limits logical processors and has nothing to do with freeing memory. My values are for my machine; do not copy them blindly.
Later, when memory was genuinely tight, vmmemWSL's working set was only a couple of hundred MB. So in that particular incident, WSL was not the main suspect. That does not retroactively prove the 4GB cap saved anything — only that WSL was not eating at the time.
Then a 1.7GB nonpaged pool sent me down the wrong path
Next I fed Task Manager's Processes and Memory screenshots to Codex Desktop. It noticed roughly 1.7GB in the nonpaged pool, and I spent a while following that lead.
I never found sustained growth, and never identified a leaking driver.
Looking back, the problem with that step was not "is 1.7GB normal." It was that a screenshot from one moment with no time series can hardly prove anything is the source. A number looking large does not make it the cause of 90% memory usage.
So after a reboot the next day I switched to a dumb but effective approach: capture the scene when memory actually runs out.
Let PowerShell capture the scene when memory bottoms out
The first version of the script checked available memory every 5 seconds and, below 1GB, listed processes by memory.
I later found a definition trap in it: it sorted by PrivateMB. To see how much is actually pressed into physical memory right now, WorkingMB is the more useful figure, so the version here sorts by working set:
while ($true) {
    $m = Get-CimInstance Win32_PerfFormattedData_PerfOS_Memory

    if ($m.AvailableMBytes -lt 1000) {
        "`n$(Get-Date) Available=$($m.AvailableMBytes)MB"

        Get-Process -ErrorAction SilentlyContinue |
            Group-Object ProcessName |
            ForEach-Object {
                [pscustomobject]@{
                    Process = $_.Name
                    WorkingMB = [math]::Round(
                        ($_.Group | Measure-Object WorkingSet64 -Sum).Sum / 1MB
                    )
                    PrivateMB = [math]::Round(
                        ($_.Group | Measure-Object PrivateMemorySize64 -Sum).Sum / 1MB
                    )
                }
            } |
            Sort-Object WorkingMB -Descending |
            Select-Object -First 10 |
            Format-Table -AutoSize
    }

    Start-Sleep 5
}
It only reads state, so it generally does not need administrator rights.
Then I opened everything I use daily — 28 Chrome tabs in total. Available memory dropped to around 600–800MB and the scene was finally captured.
One capture looked like this:
| Process | WorkingMB | PrivateMB |
|---|---|---|
| chrome | 7373 | 5090 |
| msedgewebview2 | 1386 | 2130 |
| ChatGPT | 1261 | 1093 |
| svchost | 997 | 605 |
| Typora | 613 | 543 |
| MsMpEng | 400 | 486 |
| Telegram | 434 | 430 |
| PowerToys.PowerLauncher | 76 | 379 |
| NutstoreClient | 227 | 366 |
That table knocked down most of my earlier guesses.
PowerToys Run especially: its PrivateMB is 379MB, which looks alarming, while WorkingMB is only 76MB. So "turn off PowerToys Run and save 379MB" is not valid arithmetic.
I turned it off anyway, since I almost never use Alt + Space — no harm in not keeping unused things resident.
WebView2 looks huge, and it is not one application
The next most conspicuous entry was msedgewebview2.
My first reaction was also: when did I install this?
It turns out WebView2 is the runtime that many Windows components and third-party desktop apps use to render web-style interfaces, and it is multi-process by design. A pile of msedgewebview2.exe entries in Task Manager does not mean they all belong to one application.
So you cannot go from:
msedgewebview2 1.3GB working setto:
Windows Widgets ate 1.3GBThose are not the same statement.
To find out who is actually using it, enable the "Command line" column in Task Manager's Details tab, or check parent processes, and re-attribute WebView2 processes to their host apps.
And my capture was blunt enough already: Chrome 7GB+, WebView2 about 1.3GB combined, ChatGPT 1.2GB. The real weight was all in applications I opened myself.
I still would not let it go: can Windows' own stuff be trimmed?
At that point I fixated on two things I basically never use:
- Windows 11 Widgets.
- Search Highlights and web results in Windows Search.
Adding Delivery Optimization's P2P, I wrote a reversible PowerShell script to test it.
After the previous round, though, this version did not take the "disable every service in sight" route. Three principles:
- Change policies only; do not uninstall system components.
- Do not disable SysMain, DiagTrack, Remote Registry, DoSvc and similar services.
- Record the original registry state before modifying, and restore to that recorded state rather than guessing Windows' defaults.
Delivery Optimization only got DODownloadMode set to 0, disabling P2P without disabling DoSvc.
Whether the search policies actually take effect varies across Windows editions and builds, so I am not packaging this as a "universal Windows 11 one-click optimizer." It was an experiment on my machine.
The first run was even blocked by PowerShell's execution policy — the script is unsigned — so I used, in that session:
Set-ExecutionPolicy -Scope Process BypassThat scope affects only the current PowerShell process and ends when the window closes.
Apply then ran normally, and the backup was written to:
C:\ProgramData\WinMemoryTrim\backup.jsonThe measured result: did it drop? No, no difference
Here is Task Manager after Apply, showing about 61% memory (the screenshots are of a Chinese-language Windows):
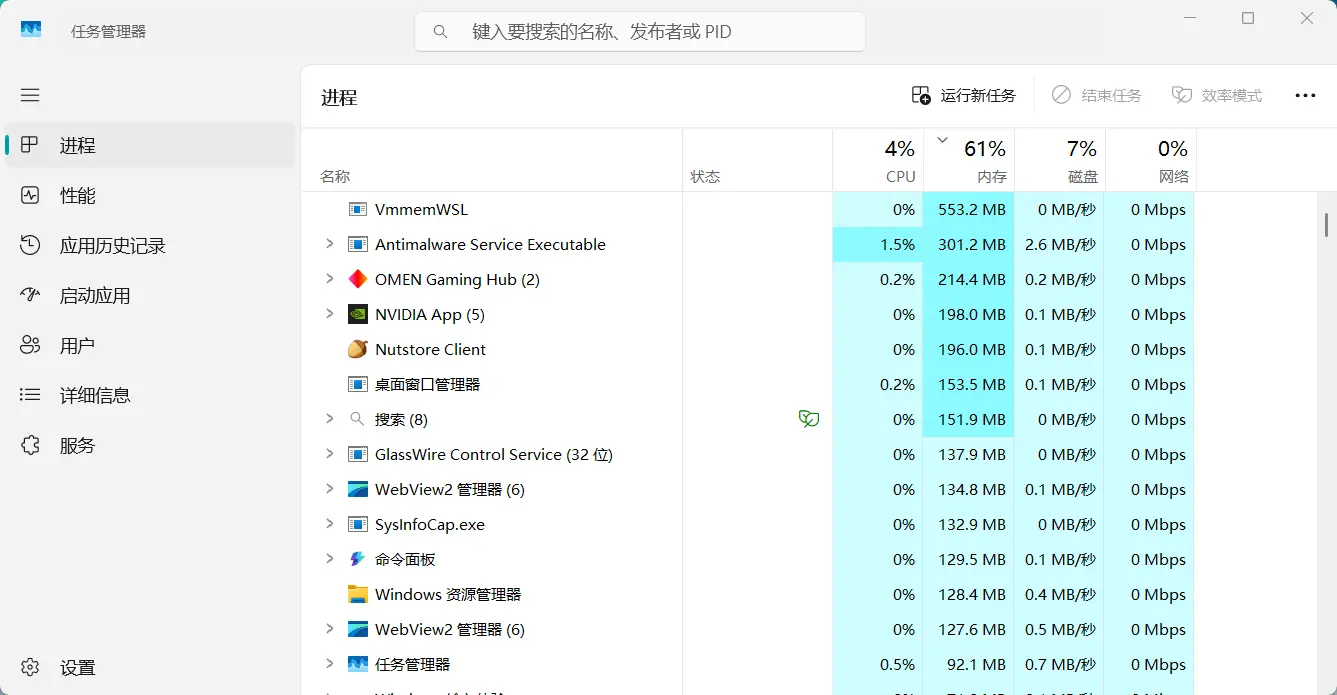
First reaction: "Oh? Did it come down?"
Then I ran the restore script. Every Widgets, Search, and Delivery Optimization policy value added earlier was deleted or restored per the backup, and Task Manager showed:
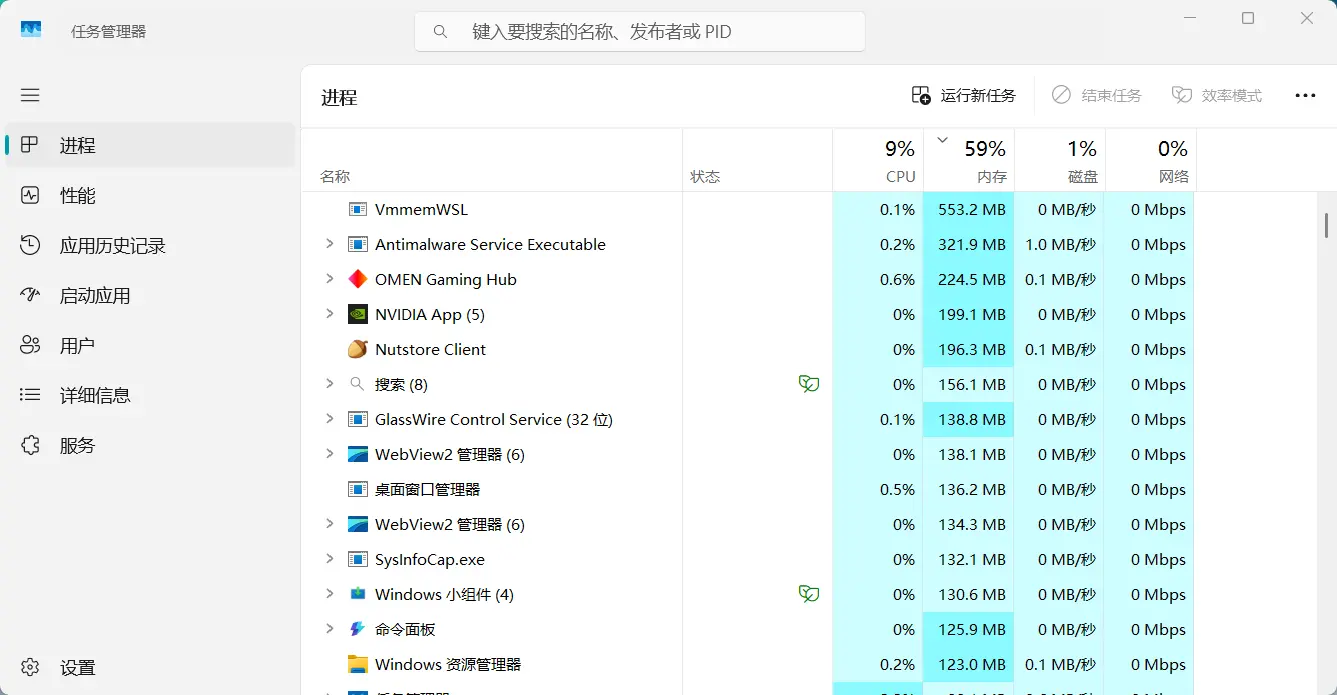
59%.
Hahaha.
Two points lower after restoring than after "optimizing."
Obviously these two screenshots are not a controlled benchmark: background processes move, Defender moves, caches move. You cannot conclude from 61% versus 59% that restoring saves memory.
What they do overturn is my original expectation:
Turning off Widgets, web results in Search, and a few Windows services will reliably free hundreds of MB, maybe 1–2GB.
On this machine, no benefit of that magnitude appeared. The difference between two rough measurements was not even stable in direction — it looks like ordinary background variation.
And after restoring, Widgets reappeared in Task Manager at a scale of a hundred-odd MB. Next to 7–8GB of Chrome, the priority is obvious.
So what actually helped?
After all that, the useful actions turned out to be mundane:
- Turn on Chrome's Memory Saver; with twenty or thirty tabs it is the most targeted change available.
- Actually close tabs you are not using — I know, and I cannot do it 🤣.
- Turn off resident features you genuinely do not use, like PowerToys Run.
- Find out which apps are keeping WebView2 alive and quit the ones that need not be resident, rather than deleting the WebView2 Runtime.
- Start WSL and VMware only when needed, or give them sensible ceilings.
- If Chrome + WSL2 + VMware + a pile of desktop apps is your permanent setup, 16GB is simply tight, and 32GB is the direct solution.
Widgets and web results in Search can of course be turned off to taste, but I would now call that "removing features I do not use" rather than "memory optimization."
If you really want to measure, do not rely on one Task Manager screenshot
My testing here was crude. To compare an optimization seriously, I would do it this way:
reboot
→ idle for a few minutes
→ fix the same set of apps / tabs
→ record available memory + working set
→ change exactly one variable
→ reboot / sign out again
→ repeat the same workload
→ run several rounds before comparing
The important part is changing one thing at a time; otherwise a number moves and you cannot say what moved it.
Also, for any "optimization script" that touches the registry, service startup types, or uninstalls system components: write and test the restore path first, before talking about one-click execution. And never hard-code defaults like "restore to Automatic" — restore whatever state the user actually had.
Finally
So the real takeaway was not "found the 2GB Windows was stealing." It was running a very believable story end to end:
memory is high
→ Windows background junk
→ disable a few services / widgets
→ easily free 1–2GB
On this machine, that chain does not hold.
What actually consumed the memory was the Chrome I opened, the WebView2 host apps I opened, ChatGPT, plus the WSL/VMware habit. Some of the built-in Windows features can indeed be switched off; do not expect them to extend the life of 16GB.
After all that "Windows memory optimization," the conclusion became:
Open fewer things, or buy more RAM.
Right — a full circle back to the first sentence 🤣.
That's all. See you next time.
Comments
Comments are powered by GitHub Discussions. Sign in with GitHub to comment. Open the matching Discussion